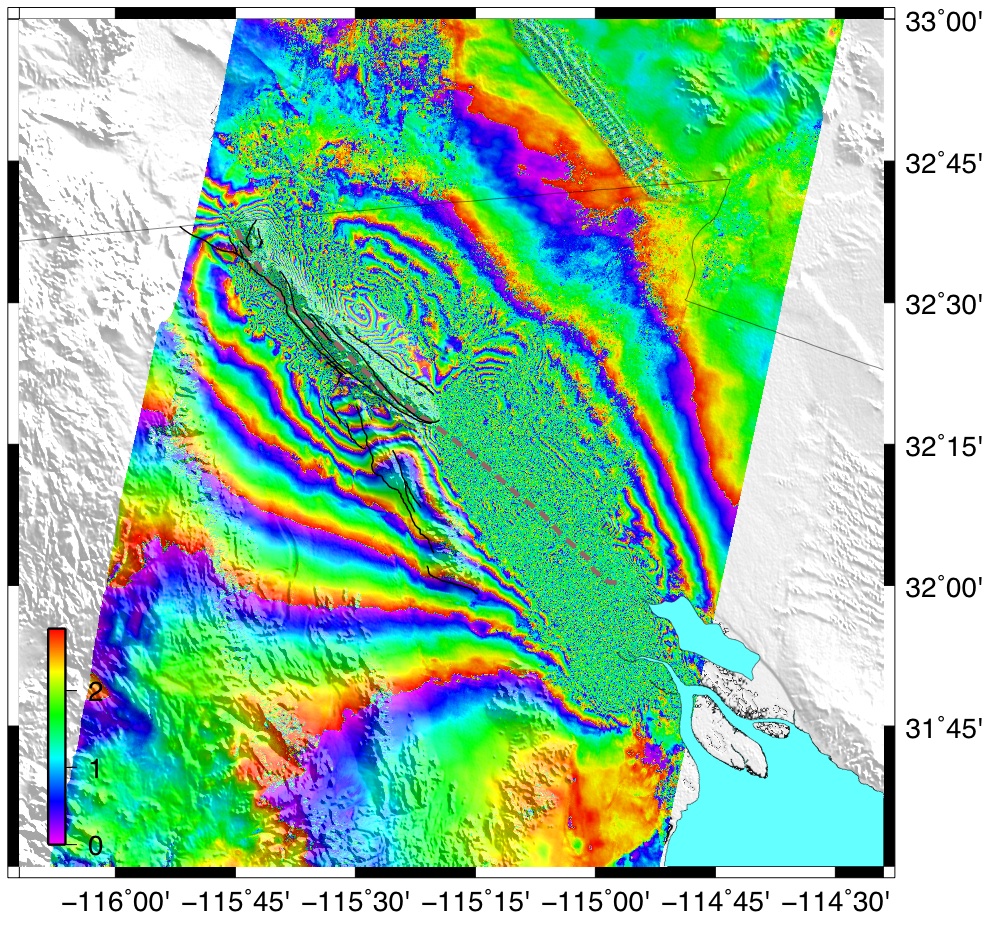
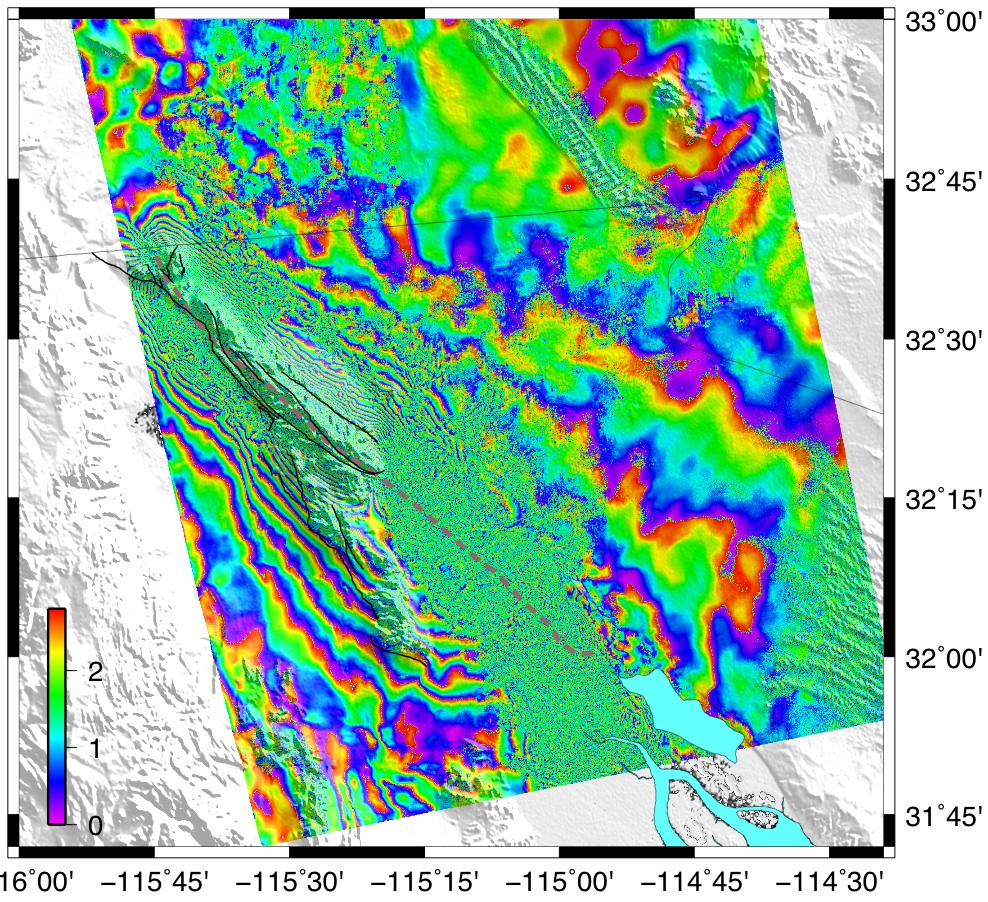
Coseismic interferogram - ALOS track 212
Rupture characteristics of M7.2 Sierra El Mayor (Mexico) earthquake
The April 4, 2010 "Easter Sunday" earthquake ruptured several NW trending faults in the Sierra Cupapa - Sierra El Mayor mountain range to the west of Laguna Salada.
Descending track 532, Feb 8 2008 - May 16
2010 (precise orbits, perperdicular baseline of 200 m). Color
fringes indicate changes in the radar range (one color cycle
corresponding to 11.8 cm of line-of-sight displacement). Black wavy
lines denote the geologically mapped rupture
trace. Dashed gray line denotes the fault trace inferred from InSAR data.
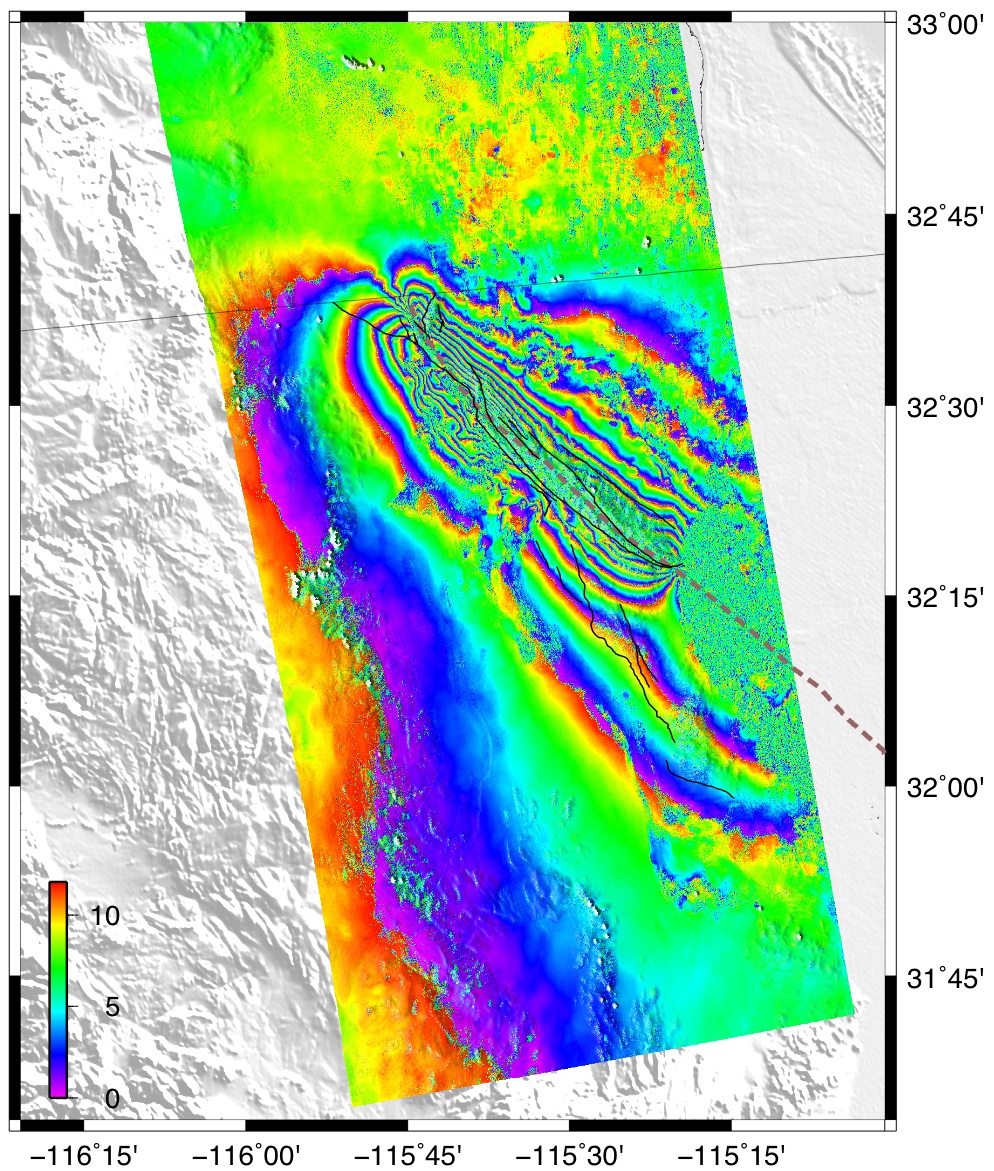
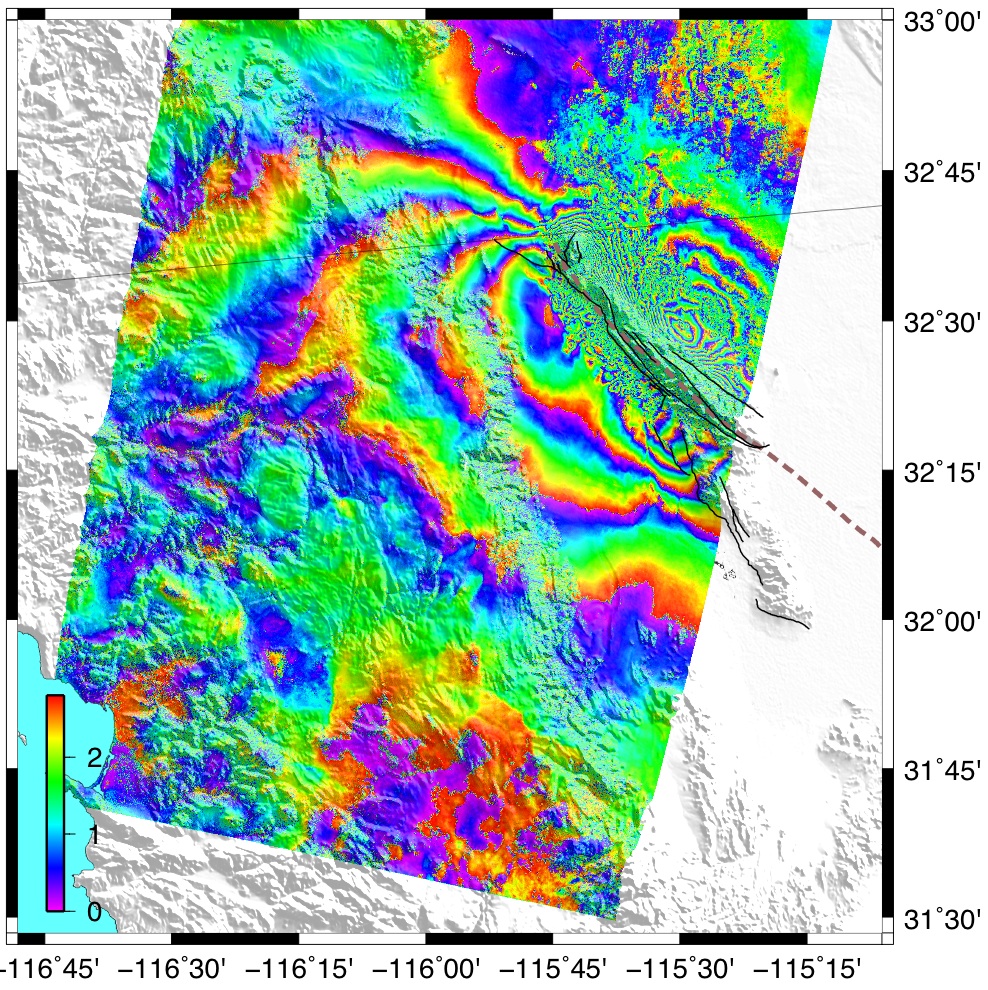
Coseismic interferogram - ALOS track 212
Ascending track 212, Dec 17 2009 - May 4
2010 (precise orbits, perperdicular baseline of 1000 m). Color
fringes indicate changes in the radar range (one color cycle
corresponding to 11.8 cm of line-of-sight displacement). Black wavy
lines denote the geologically mapped rupture
trace. Dashed gray line denotes the fault trace inferred from InSAR data.
Coseismic interferogram - ENVISAT track 84
Descending track 84, Mar 28 2010 - May 2 2010
(preliminary orbits, perperdicular baseline of 90 m). Color fringes
indicate changes in the radar range (one color cycle corresponding to
2.8 cm of line-of-sight displacement). Black wavy lines denote the
geologically mapped surface ruptures. Dashed gray line denotes the fault trace inferred from InSAR data
Coseismic interferogram - ENVISAT track 77

Ascending track 77, Mar 28 2010 - May 2 2010
(preliminary orbits, perperdicular baseline of 200 m). Color fringes
indicate changes in the radar range (one color cycle corresponding to
2.8 cm of line-of-sight displacement). Black wavy lines denote the
geologically mapped surface ruptures. Dashed gray line denotes the fault trace inferred from InSAR data
Coseismic interferogram - ENVISAT track 356
Descending track 356, Mar 12 2010 - Apr 16 2010
(preliminary orbits, perperdicular baseline of 240 m). Color fringes
indicate changes in the radar range (one color cycle corresponding to
2.8 cm of line-of-sight displacement). Black wavy lines denote the
geologically mapped surface ruptures. Dashed gray line denotes the fault trace inferred from InSAR data
Coseismic interferogram - ENVISAT track 306
Ascending track 306, Mar 9 2010 - Apr 13 2010
(preliminary orbits, perperdicular baseline of 270 m). Color fringes
indicate changes in the radar range (one color cycle corresponding to
2.8 cm of line-of-sight displacement). Black wavy lines denote the
geologically mapped surface ruptures. Dashed gray line denotes the fault trace inferred from InSAR data
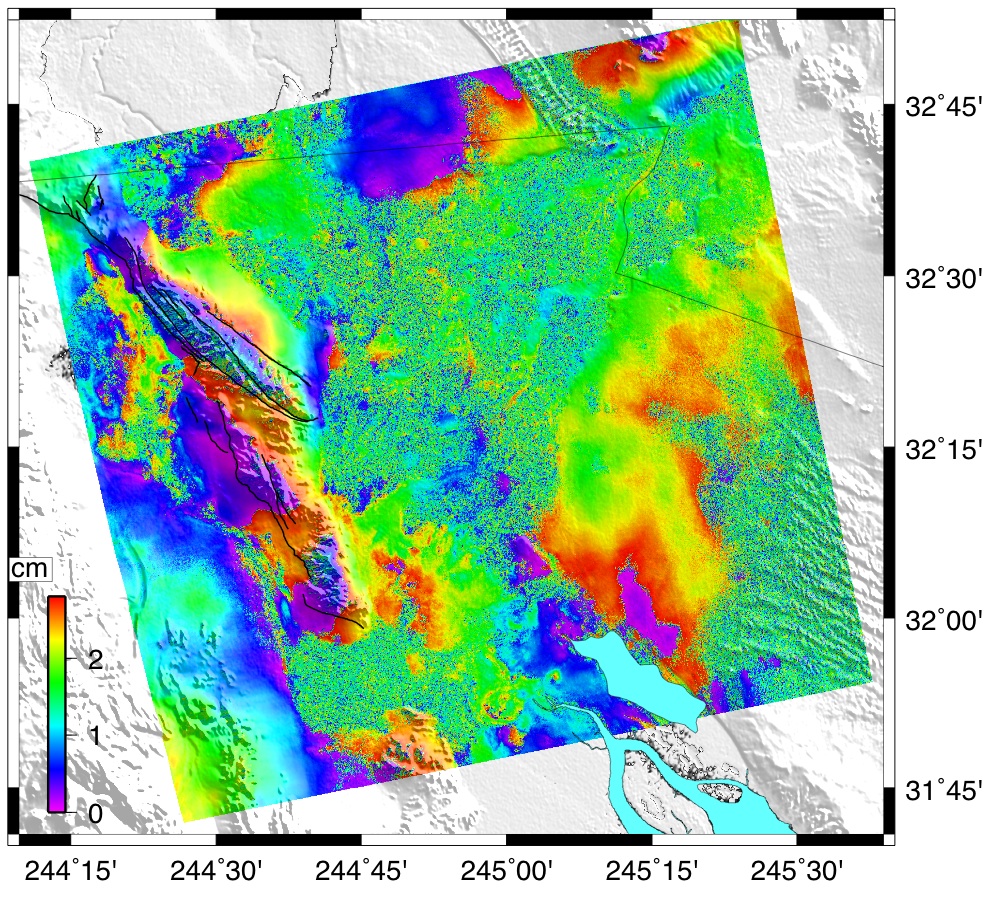
Azimuthal offsets - ENVISAT
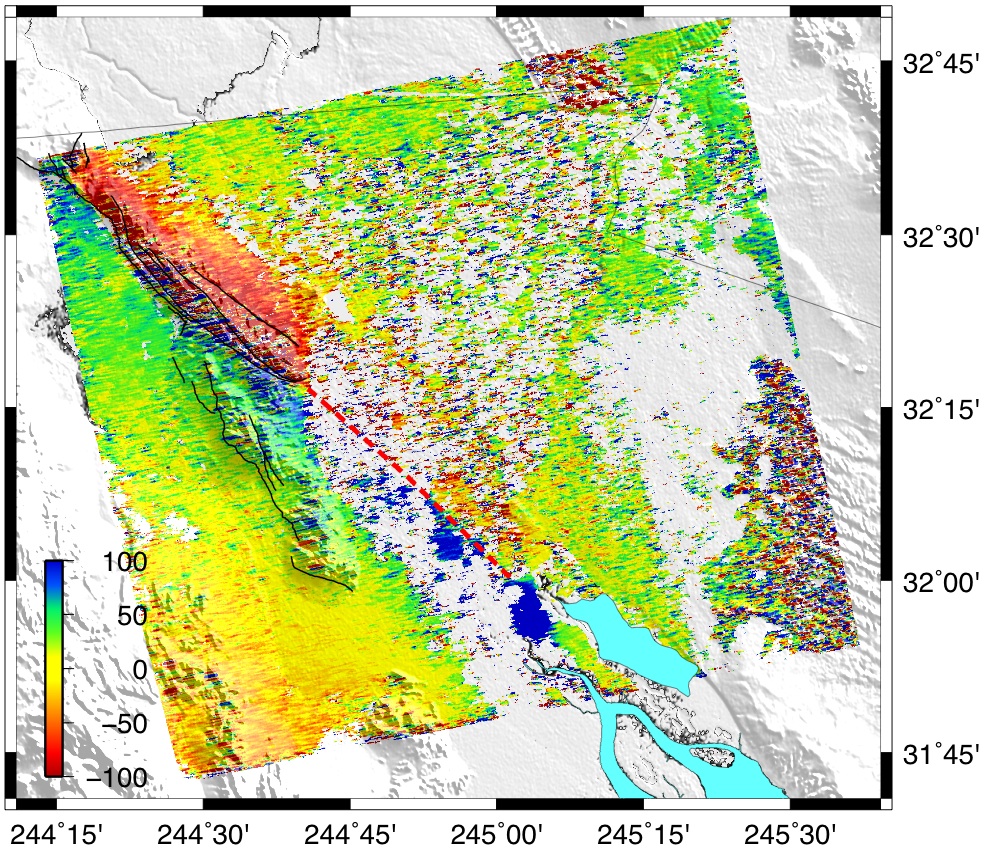
Ascending track 306, Mar 9 2010 - Apr 13 2010
(preliminary orbits, perperdicular baseline of 270 m). Colors indicate
a component of horizontal displacements orthogonal to the satellite
line of sight, in centimeters, as inferred from cross-correlation of
the amplitude of radar images. Black wavy lines denote the
geologically mapped rupture
trace. Dashed red line denotes the presumed location of the fault
to the South-East of the Cupapa mountains (not mapped by field surveys
due to the absence of a clear fault trace).
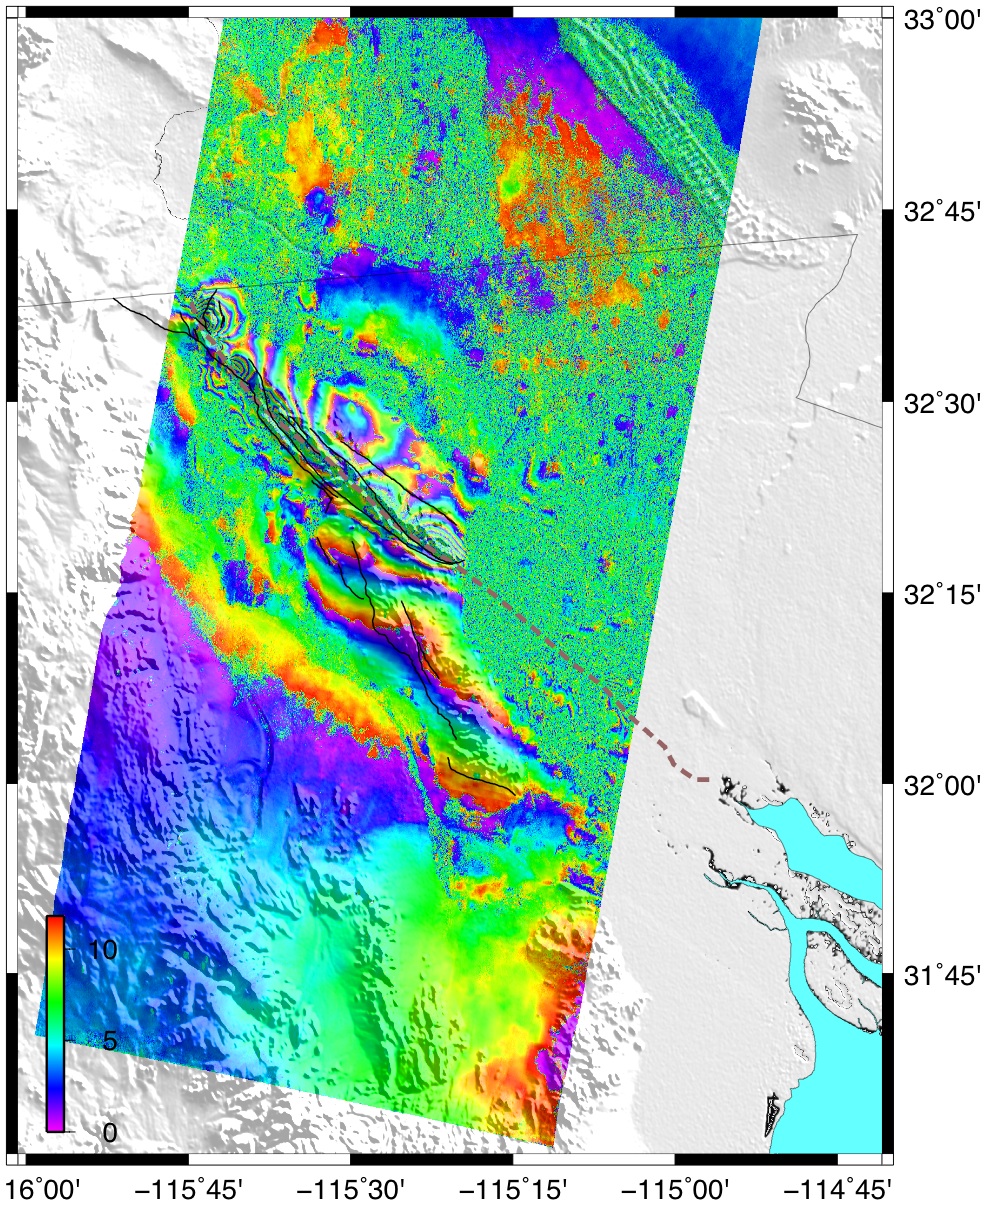
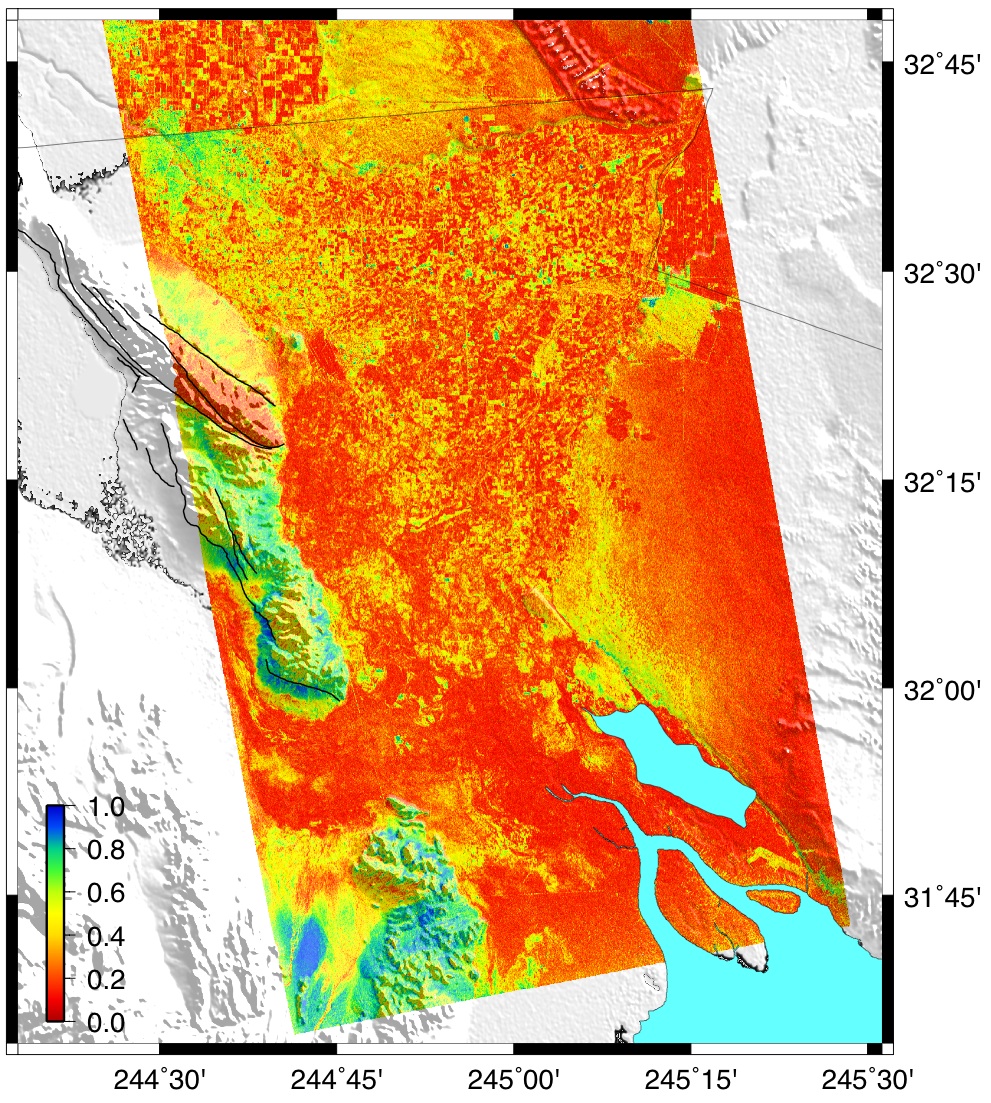
Interferometric correlation
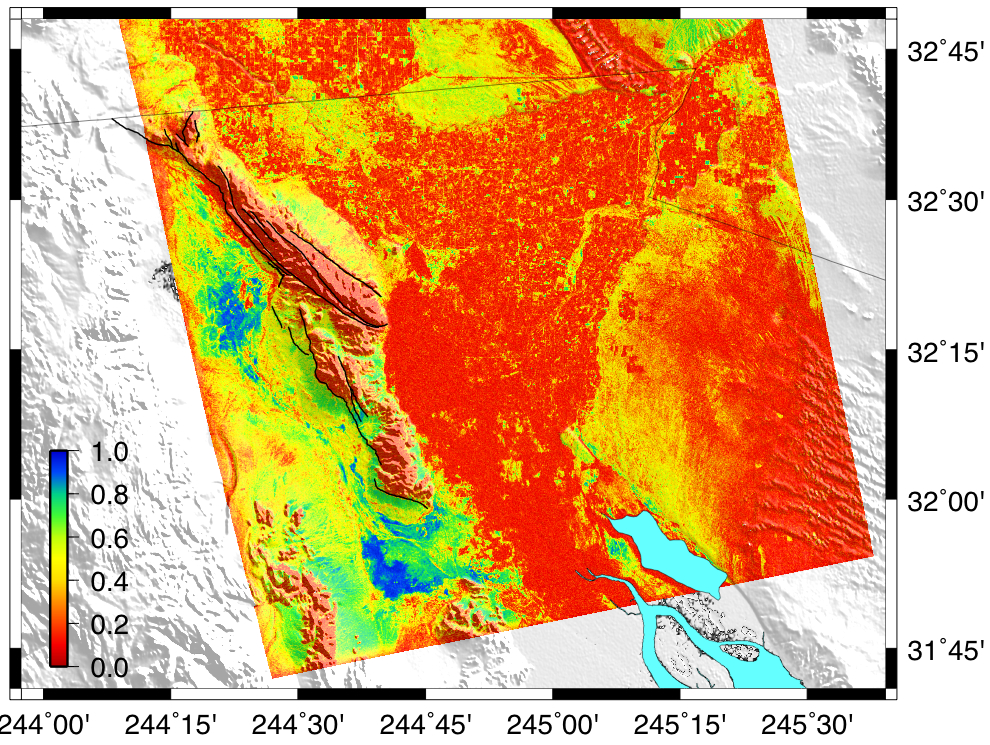
Same pair as above. Color
denotes variations in radar correlation. Zones of low correlation
(red areas) denote significant changes in reflective properties of
the ground. Note a wide fault zone in the Cupapa mountains and
extensive decorrelation in the agricultural area to the east of the
rupture (possibly due to extensive liquefaction).
Coseismic interferogram - ALOS track 533

Descending track 533, Jan 10 2008 - Apr 17
2010 (preliminary orbits, perperdicular baseline of 5 m). Color
fringes indicate changes in the radar range (one color cycle
corresponding to 11.8 cm of line-of-sight displacement). Black wavy
lines denote the geologically mapped rupture
trace.
Coseismic interferogram - ALOS track 211

Ascending track 211, Jan 15 2010 - Apr 17
2010 (preliminary orbits, perperdicular baseline of 700 m). Color
fringes indicate changes in the radar range (one color cycle
corresponding to 11.8 cm of line-of-sight displacement). Black wavy
lines denote the geologically mapped rupture
trace.
Interferometric correlation
Same pair as above. Color
denotes variations in radar correlation. Zones of low correlation
(red areas) denote significant changes in reflective properties of
the ground. Note a wide fault zone in the Cupapa mountains and
extensive decorrelation in the agricultural area to the east of the
rupture (possibly due to extensive liquefaction).
Preseismic interferogram - ENVISAT
ENVISAT, Nov 24 2009 - Mar 9 2010, ascending track
306. Color fringes indicate changes in the radar range (one color
cycle corresponding to 2.8 cm of line-of-sight displacement). Black
wavy lines denote the geologically mapped rupture trace.
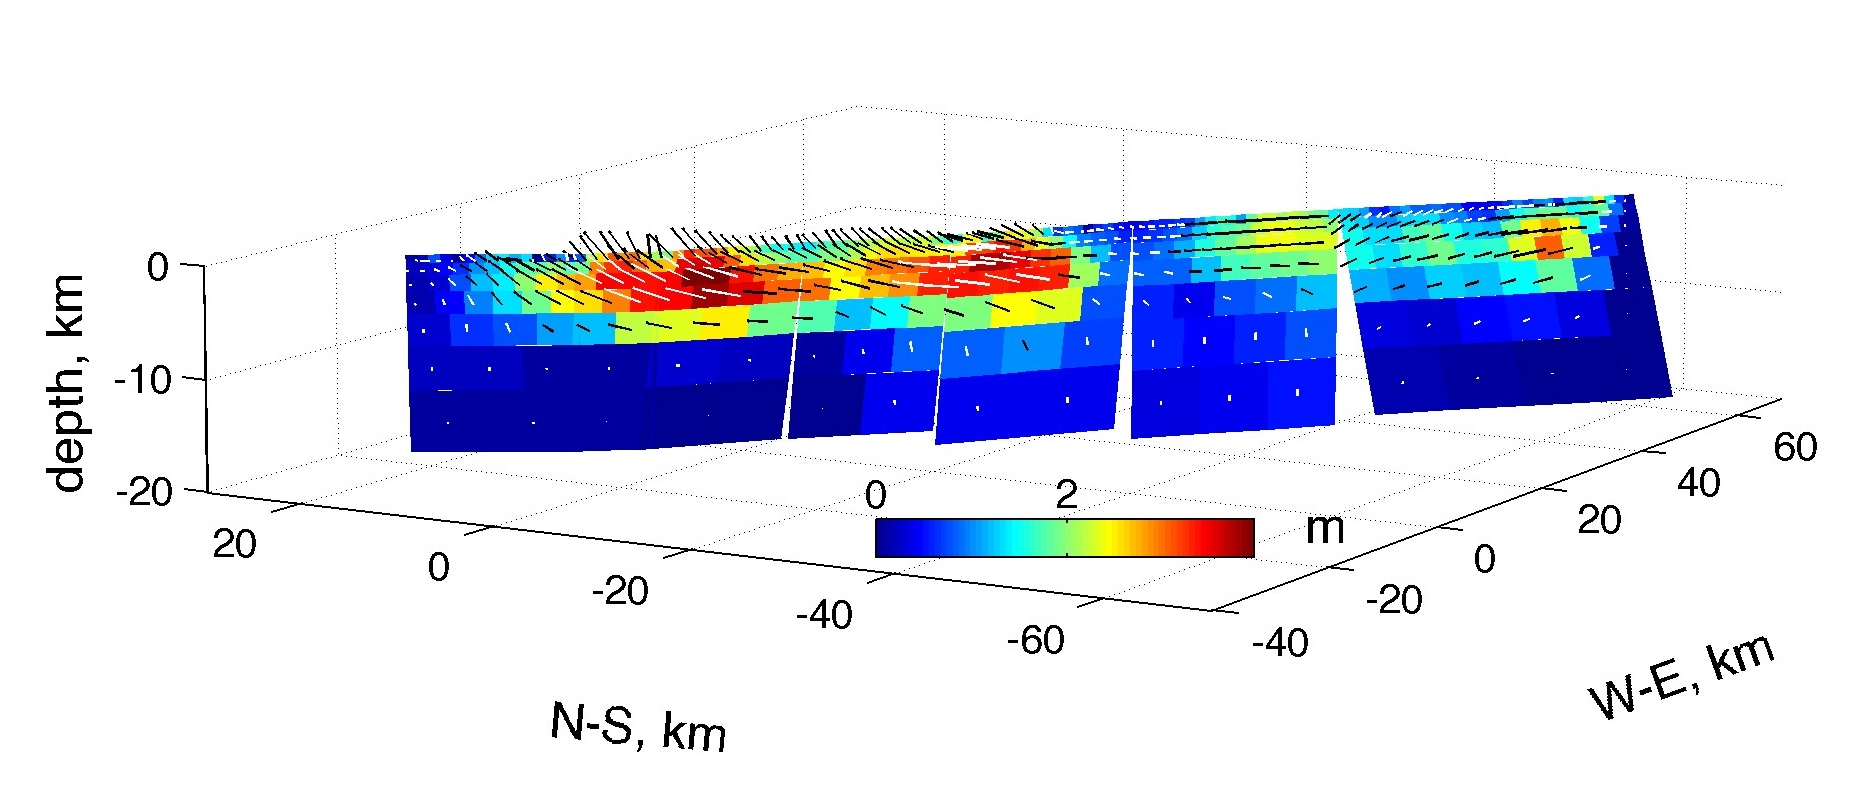
Fault slip model