Global Maps of
Long-Period Surface Wave Dispersion
Sorry, this site is under construction.

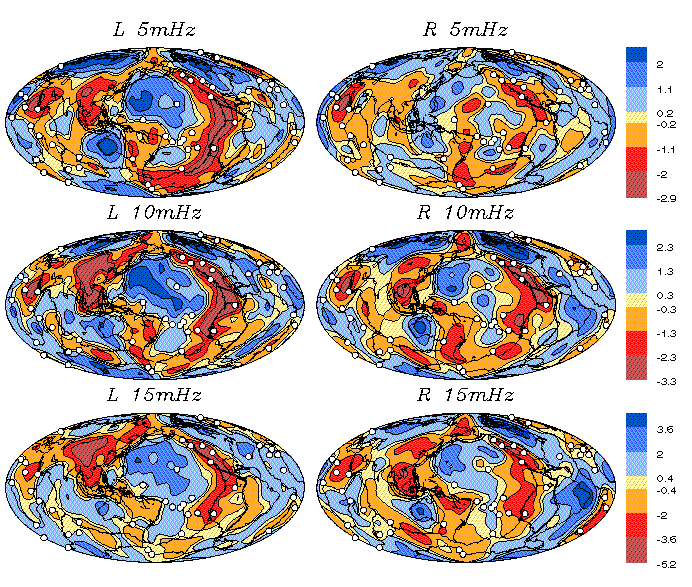
Global Phase Velocity Maps:
Phase velocity maps for Love (left) and Rayleigh waves (right) at 5,10 and
15 mHz. These maps show percentage phase velocity perturbation after the
mean has been taken out. The amplitudes in the maps increase with frequency
but never exceeds 7%.
The white dots mark hotspot locations used by Phipps-Morgan
et al. (1995).
|
Abstract:
Global phase velocity maps of long-period surface waves are an essential
ingredient in modeling 3-D shear wave velocity and are capable of
particularly good lateral resolution of upper mantle structure.
Unfortunately, even recently derived maps disagree for harmonic degrees
greater than about l=6 so that further improvement is required.
The resolution can be dramatically improved by adding both amplitude and
polarization data
to the inversion process. Both amplitude and polarization
depend on the lateral gradients of phase velocity and hence constrain the
short-wavelength structure of the resulting models. Amplitude,
polarization, and phase are readily determined for each arriving wave
packet using
multitaper techniques and can be interpreted using linear
perturbation theory .
The size of our phase and polarization data sets
obtained from seismograms of the global seismic broadband networks
GEOSCOPE,
IDA/IRIS (International Deployment of Accelerometers/Incorporate Research
Institutions for Seismology) and
IRIS/USGS (U.S. Geological Survey)
justifies inversion for phase velocity expanded in spherical harmonics up
to l=24.
While the phase data between 3 and 15~mHz do not require
structure beyond about l=8, small-amplitude structure of harmonic degree
greater than 8 is needed to fit the polarization data
. Checkerboard tests
show that the resolution of phase velocity is greatly improved when
polarization data are added to the inversion.
Since amplitude data also
depend on 3-D anelastic structure of the mantle, these data need a more
comprehensive interpretation, and we cannot expect to fit them with a
purely elastic model. However, we showed that a good fraction
of the amplitude signal is consistent with our phase velocity maps and that
it is possible to obtain maps which simultaneously explain both amplitude
and polarization data.
Publication:
Laske, G. and G. Masters, Constraints on global phase velocity
maps by long-period polarization data. J. Geophys. Res., 101,
16,059-16,075, 1996.
Want a reprint with color figures?
mail to Gabi.
How to get the maps:
The maps are available via anonymous ftp to carp....
ftp carp.ucsd.edu  (132.239.154.12)
cd pub/gabi/phase
prompt
get README
mget m*
binary
get jgr.fig8.ps.Z
quit
(if you are on a UNIX machine, simply umcompress Figure 8 by
typing)
uncompress jgr.fig8.ps
.... or via download
ftp://carp.ucsd.edu/pub/gabi/phase.
top
How well do the maps explain the data?
... sorry, this part is under construction.
top
How well do the data constrain the maps?
Checkerboard tests
... sorry, this part is under construction.
top
References
Phipps Morgan, J., W.J. Morgan, Y.-S. Zhang, and W.H.F. Smith,
Observational hints for a plume-fed, suboceanic asthenosphere and its
role in mantle convection,J. Geophys. Res., 100, 12,753-12767, 1995.
top
Gabi Laske (
glaske@ucsd.edu)
Goto
Gabi's Home page
Goto
Scripps 3D mantle models
 To IGPP Home


 To IGPP Home