SWELL (Seismic Wave Exploration in the Lower Lithosphere)
PIs: G. Laske (SIO), J. A. Orcutt (SIO), J. Phipps Morgan (SIO, now at GEOMAR)
The SWELL experiment was a pilot study designed to show the feasibility of using intermediate-period (15-80s) Rayleigh waves recorded by ocean bottom instruments to study upper mantle structure beneath an isolated mid-plate hotspot. The principal scientific motivation for this experiment was to characterize the interaction between the plume and the uppermost mantle, in particular to address the origin of the hotspot-related bathymetric swell. Eight SIO L-CHEAPO instruments with differential pressure gauge (DPG) sensors (Figure 1) were deployed at ~200km station spacing in a hexagonal array with the center being roughly 375km to the south-west of Big Island/Hawaii (Figures 2a/3). Two instruments were located at the central site, at a separation of about 25 km, to guarantee the full lateral resolution of the array should one instrument fail. The array extended across the width of this part of the swell and encompassed the Ocean Seismic Network pilot borehole seismometer installation at ODP site. The instruments were deployed for a total of 12.5 months with one recovery/re-deployment cruise after the first 12.5 months.
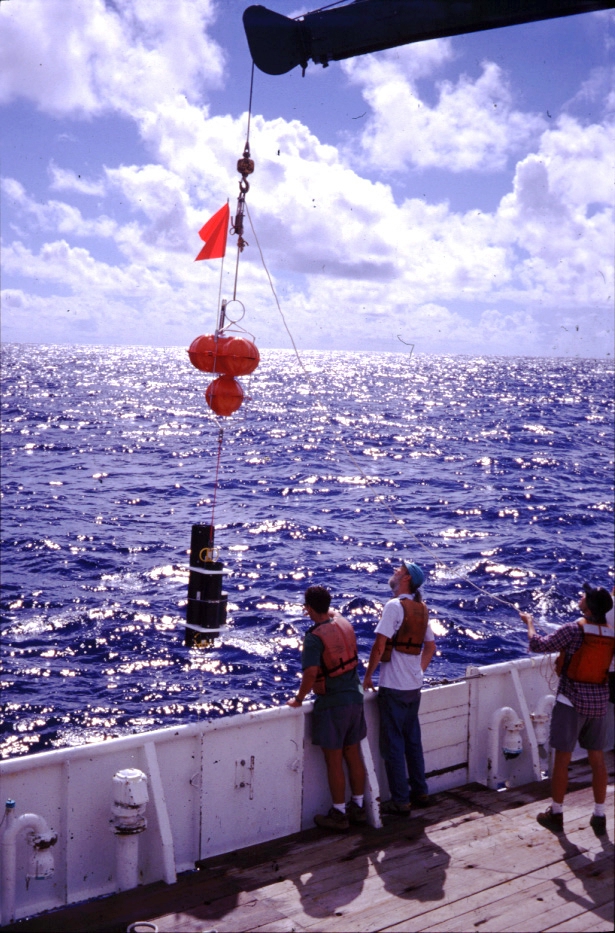
Figure 1
: A Scripps Institution of Oceanography L-CHEAPO instrument equipped with a broad-band differential pressure gauge sensor being deployed for the SWELL experiment.
The most important questions to be resolved by the pilot study were (1) Can the newly built instruments be deployed in a long-term deployment and recovered successfully? (2) Are the instruments reliable? (3) Does a one-year recording period yield sufficient data? (4) Is the instrumentation appropriate to record the longer period (> 50 s) Rayleigh waves necessary to resolve structure beneath the lithosphere (> 80 km)? (5) Is the station spacing selected adequate for measuring dispersion at long periods? (6) Does the data quality allow us to discriminate among models for age variations in oceanic lithosphere and to constrain the dominant mechanism that supports the swell?
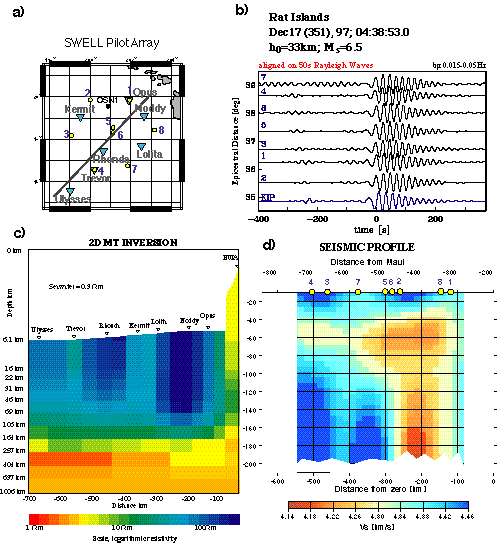
Figure 2
: a) Site map of the SWELL Pilot array. Numbers mark seismic sites, while names mark the MT sites. The OSN1 test borehole site is also marked. b) Example of SWELL seismic data for a Rat Islands event. The blue trace is the vertical record from GSN station KIP (Kipapa, Oahu). The KIP seismogram is not corrected for instrumental response or converted to pressure. All records have been bandpass filtered. c) 2D MT resistivity model and (d) 2D profile through 3D seismic shear velocity model obtained across the SWELL pilot array (line indicated in map in (a)).
The collected surface wave records include high-quality waveforms from 84 teleseismic shallow events that were well distributed in azimuth (Figure 2b). For most of the 84 events, dispersion could be measured at periods between 17 and 50 s. The high quality of the waveforms for some events allowed these measurements to be extended to 70 s and beyond. The analysis provided over 50 dispersion curves with error bars small enough to reliably distinguish between the predictions for a lithosphere-asthenosphere velocity models. The good azimuthal coverage of events also constrained upper mantle anisotropy beneath the array and permitted an unbiased estimate of the average isotropic seismic structure beneath the pilot array to be obtained. The average azimuthally isotropic structure that beneath the array is very similar to that of 90-My-old lithosphere. The average amount of the average azimuthal anisotropy is rather modest; no greater than 2% at periods of 30- 60 s. The direction of fast phase velocity follows the current plate motion direction for periods longer than 40 s and tends toward the fossil spreading direction for shorter periods. This is in accordance with a two-layer anisotropic model in which flow induced by plate shear dominates anisotropy in the asthenosphere and anisotropy aligned with the fossil spreading direction is ‘frozen’ into the lithosphere.
More interestingly, there is clear evidence for a strong lateral gradient in structure across the array. Phase velocity maps obtained by measuring the dispersion between each two-station leg of the pilot array, as a function of period, suggest small changes at short periods but at periods greater than 35 s there is a pronounced velocity gradient perpendicular to the island chain, with anomalously low velocities close to the islands. Inversions of the phase velocity maps reveal a moderately deep swell root that is restricted to be close to the island chain (Figure 2d). These results demonstrate clearly that surface wave tomography carried out with a larger network can resolve the deep structure of the Hawaiian swell (Laske et al., 1999).
Modelling of the seismic velocities found near the island chain suggest that most of the low seismic anomalies may be caused by purely temperature effects, but the presence of a small fraction of partial melt (<2%) cannot be ruled out. The seismic pilot deployment also included a co-deployment of 8 MT instruments (PIs: Steve Constable, SIO and Graham Heinson and Antony White, Flinders University, Adelaide). This study found no increase in electrical conductivity near the islands as would be expected if significant fractions of connected partial melt were present (Figure 2c). This is further evidence that most of the anomaly seen in the seismic signal must be caused by elevated temperature in this area.
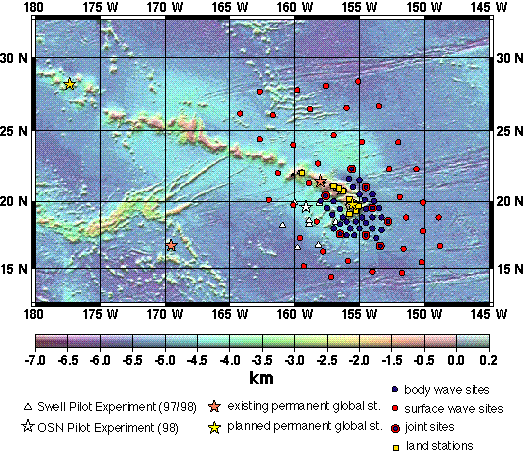
Figure 3
: Location map and network design for the PLUME experiment. The Hawaiian swell is the region of shallow bathymetry (light blue) extending roughly 500km to the north and south of the Hawaiian island chain. Shown are locations of the proposed OBS sites for both the body wave and the surface wave tomographic studies. Shared sites are marked separately. Also shown are the locations of the proposed land-based instruments, the previous SWELL pilot experiment sites, the OSN-1 site, and stations of the permanent Global Seismic Network.
The SWELL pilot experiment, together with the MELT experiment (Forsyth et al., 1998) were the first ever long-term deployments in the ocean to record intermediate-period surface waves. The SIO L-CHEAPO instruments were originally designed and subsequently being used for short-term deployments of active-source experiments. Such studies typically determined oceanic crustal structure and perhaps mantle structure just below the MOHO discontinuity. The success of the MELT and the SWELL pilot experiments have forever changed the scientific research objectives of ocean seismic experiments and provided major impetus for the Oceanic Mantle Dynamics Science Plan presented to the National Science Foundation. The SWELL pilot experiment will find its continuation as part of the PLUME (Plume Lithosphere Undersea Mantle Experiment) (Figures 3 and 4). This is a multi-institutional experiment, lead by SIO, and includes Pis from WHOI (Bob Detrick, John Collins), CIW (Sean Solomon, Erik Hauri), University of Hawaii (Cecily Wolfe) and Yale University (David Bercovici). Scientific components are the surface wave study (SIO), body wave tomography (UH/CIW), receiver function and shear wave splitting analyses (UW/CIW/WHOI), geodynamic modelling (Yale) and geochemical data collection and modelling (CIW). The PLUME experiment will address fundamental geodynamical issues on how the Hawaiian hotspot ‘’works’’ (Figure 4): - what is the geometry of the plumbing of the Hawaiian hotspot? - where and how wide is the central plume pipe? - is the lithosphere being reheated by the ascending mantle material? - is the lithosphere affected by underplating of melt depleted mantle residuum? - does the overlying moving plate drag hot asthenosphere material along the chain? - does the plume penetrate into the lower mantle?
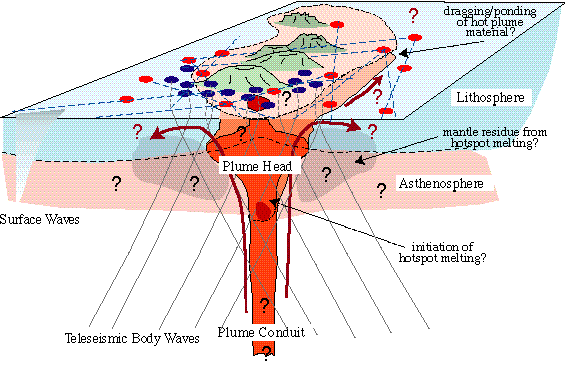
Figure 4
: Schematic representation of possible aspects of a plume beneath the Hawaiian hotspot and its interaction with the lithosphere and asthenosphere beneath the Hawaiian Swell.
References:
Forsyth, D.W., S.C. Webb, L.M. Dorman, and Y. Shen, Phase velocities of Rayleigh waves in the MELT experiment on the East Pacific Rise, Science, 280, 1235-1238, 1998.
Laske, G., J. Phipps Morgan, and J.A. Orcutt, First results from the Hawaiian SWELL pilot experiment, Geophys. Res. Let., 26, 3397-3400, 1999.