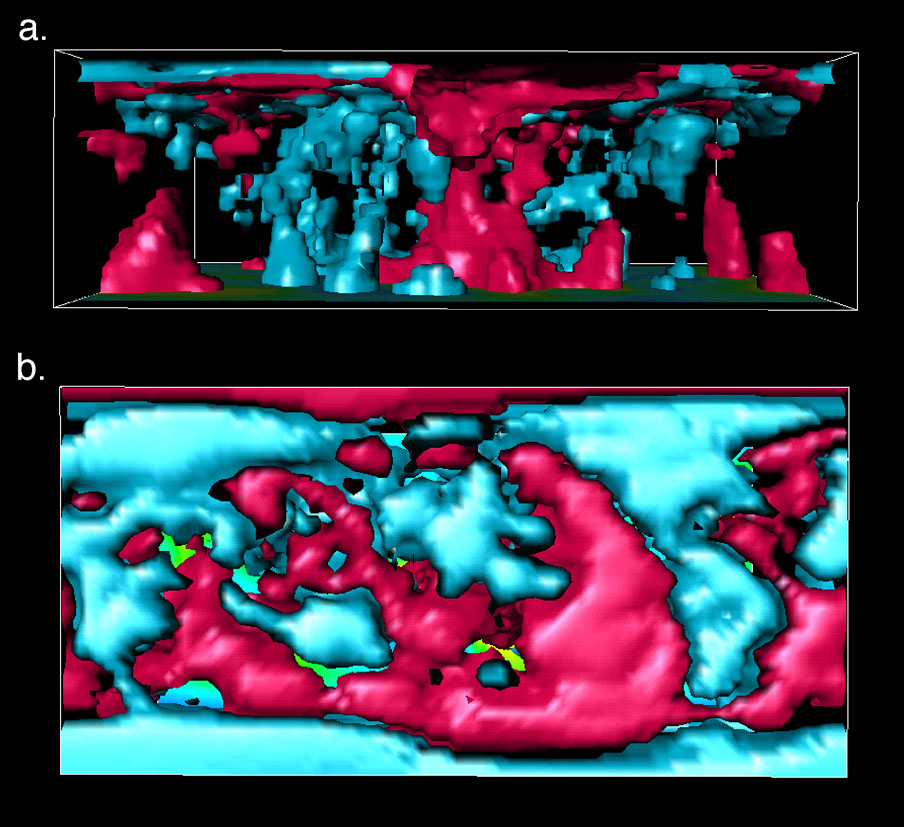
 Fast ("cold") and slow ("hot") anomalies in the mantle, as imaged by seismic tomographic model SB4L18 (G. Masters, G. Laske, H. Bolton, A. Dziewonski, in Mineral Physics and Seismic Tomography, S. Karato et al. eds, AGU, Washington DC, 2000). (a) Looking from the south, with the CMB at the bottom of the image and the surface at the top of the image, downwelling slabs (blue) appear to sink to the CMB in most areas. Two large megaplumes (red) are observed underneath Africa (left of image) and the Pacific (center of image). (b) Looking down from above, the pattern of continents and oceans is clearly visible. Contoured velocity values are 0.6% fast (blue) and 1% slow (red).
 The magnetic field viewed at the core surface. This image
has been generated from a mathematical computer model derived
from satellite observations of the magnetic field taken by
the satellite Magsat in 1980. The core radius is only 3485
km, roughly half that of the Earth's radius. Blue contours
indicate the strength of the radial magnetic field entering
the core surface, and red contours the strength of the radial
field exiting the core surface., and white lines are actual
field lines. The picture clearly shows the tilt of the
magnetic field away from the rotation axis of the earth by
about 10 degrees. This is the major ingredient of the field's
deviation from axisymmetry; this lack of axisymmetry is an
essential part of dynamo theory, the theory describing how
the magnetic field is recreated over time, and is what makes
the subject so difficult.
The magnetic field viewed at the core surface. This image
has been generated from a mathematical computer model derived
from satellite observations of the magnetic field taken by
the satellite Magsat in 1980. The core radius is only 3485
km, roughly half that of the Earth's radius. Blue contours
indicate the strength of the radial magnetic field entering
the core surface, and red contours the strength of the radial
field exiting the core surface., and white lines are actual
field lines. The picture clearly shows the tilt of the
magnetic field away from the rotation axis of the earth by
about 10 degrees. This is the major ingredient of the field's
deviation from axisymmetry; this lack of axisymmetry is an
essential part of dynamo theory, the theory describing how
the magnetic field is recreated over time, and is what makes
the subject so difficult.
 Cutaway of the Earth showing the magnetic field generated in the core
by a computer model of the "geodynamo". Half of the core shows the
strength of the radial field (blue and yellow being opposite polarities),
the other half shows the tangential component of the fluid velocities which
are responsible for maintaining the field and for generating the secular
variation (the change in the magnetic field with time).
The "geodynamo" process has maintained the field for almost
the entire life of the Earth, four and a half billion years.
Cutaway of the Earth showing the magnetic field generated in the core
by a computer model of the "geodynamo". Half of the core shows the
strength of the radial field (blue and yellow being opposite polarities),
the other half shows the tangential component of the fluid velocities which
are responsible for maintaining the field and for generating the secular
variation (the change in the magnetic field with time).
The "geodynamo" process has maintained the field for almost
the entire life of the Earth, four and a half billion years.
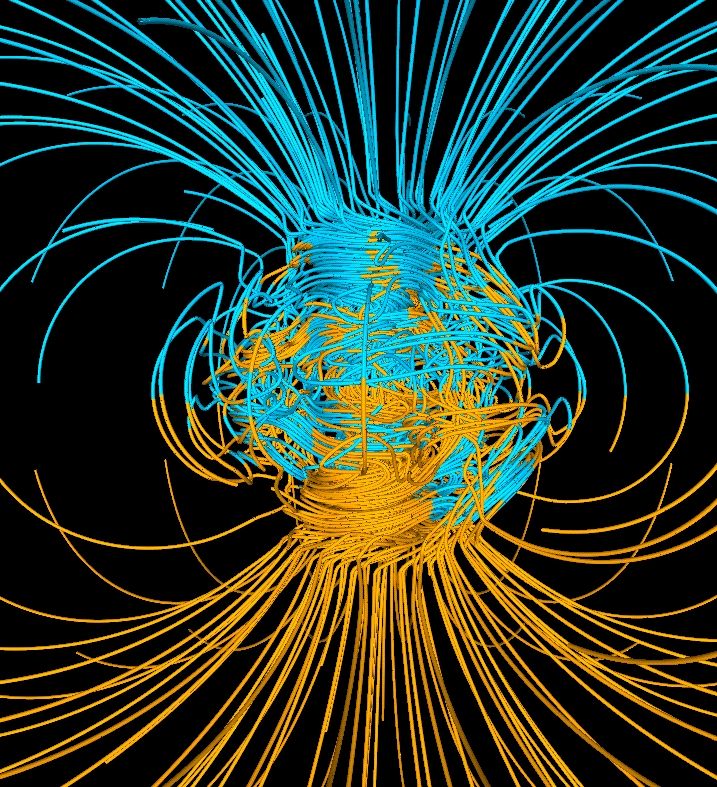 A snapshot of the 3D magnetic field structure simulated with the
Glatzmaier-Roberts geodynamo model. Magnetic field lines are blue where
the field is directed inward and yellow where directed outward.
The rotation axis of the model Earth is vertical and through the center.
A transition occurs at the core-mantle boundary from the intense,
complicated field structure in the fluid core, where the field is generated,
to the smooth, potential field structure outside the core. The field
lines are drawn out to two Earth radii. Magnetic field is wrapped around the
"tangent cylinder" due to the shear of the zonal fluid flow.
A snapshot of the 3D magnetic field structure simulated with the
Glatzmaier-Roberts geodynamo model. Magnetic field lines are blue where
the field is directed inward and yellow where directed outward.
The rotation axis of the model Earth is vertical and through the center.
A transition occurs at the core-mantle boundary from the intense,
complicated field structure in the fluid core, where the field is generated,
to the smooth, potential field structure outside the core. The field
lines are drawn out to two Earth radii. Magnetic field is wrapped around the
"tangent cylinder" due to the shear of the zonal fluid flow.
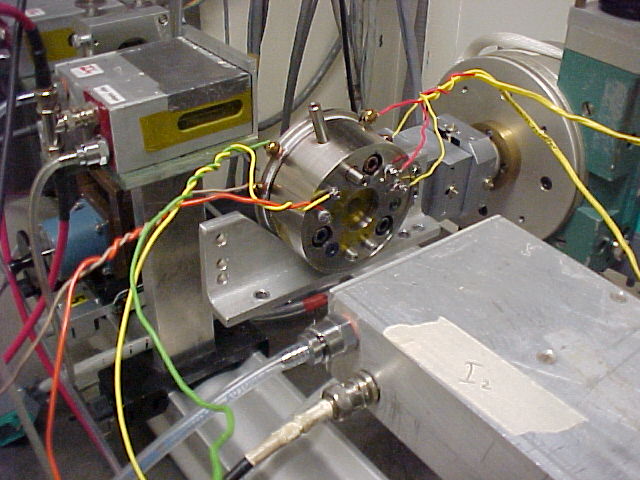 Picture of the hydrothermal
diamond anvil cell developed by W. A. Bassett and A. H. Shen in the Mineral Physics
group at Cornell.
The principle of these experiments is that after the first heating cycle,
the sample chamber behaves as an isochoric system. The equation of state
of water is well known. This information, along with the determination
of the density of the water in the cell from its homogenization
temperature, yields an accurate pressure at any temperature. Pressures
of 22 kbar and temperatures of over 1300 K have been attained. The cell
has [has] enabled in situ study of water speciation in silicate melts
through IR spectroscopy, of phase transitions and P-V-T diagrams using
optical microscopy and x-ray diffraction, and of speciation and structure
of transition metals and REE'S in solution using x-ray absorption
spectroscopy. Photo courtesy of Bill Bassett.
Picture of the hydrothermal
diamond anvil cell developed by W. A. Bassett and A. H. Shen in the Mineral Physics
group at Cornell.
The principle of these experiments is that after the first heating cycle,
the sample chamber behaves as an isochoric system. The equation of state
of water is well known. This information, along with the determination
of the density of the water in the cell from its homogenization
temperature, yields an accurate pressure at any temperature. Pressures
of 22 kbar and temperatures of over 1300 K have been attained. The cell
has [has] enabled in situ study of water speciation in silicate melts
through IR spectroscopy, of phase transitions and P-V-T diagrams using
optical microscopy and x-ray diffraction, and of speciation and structure
of transition metals and REE'S in solution using x-ray absorption
spectroscopy. Photo courtesy of Bill Bassett.
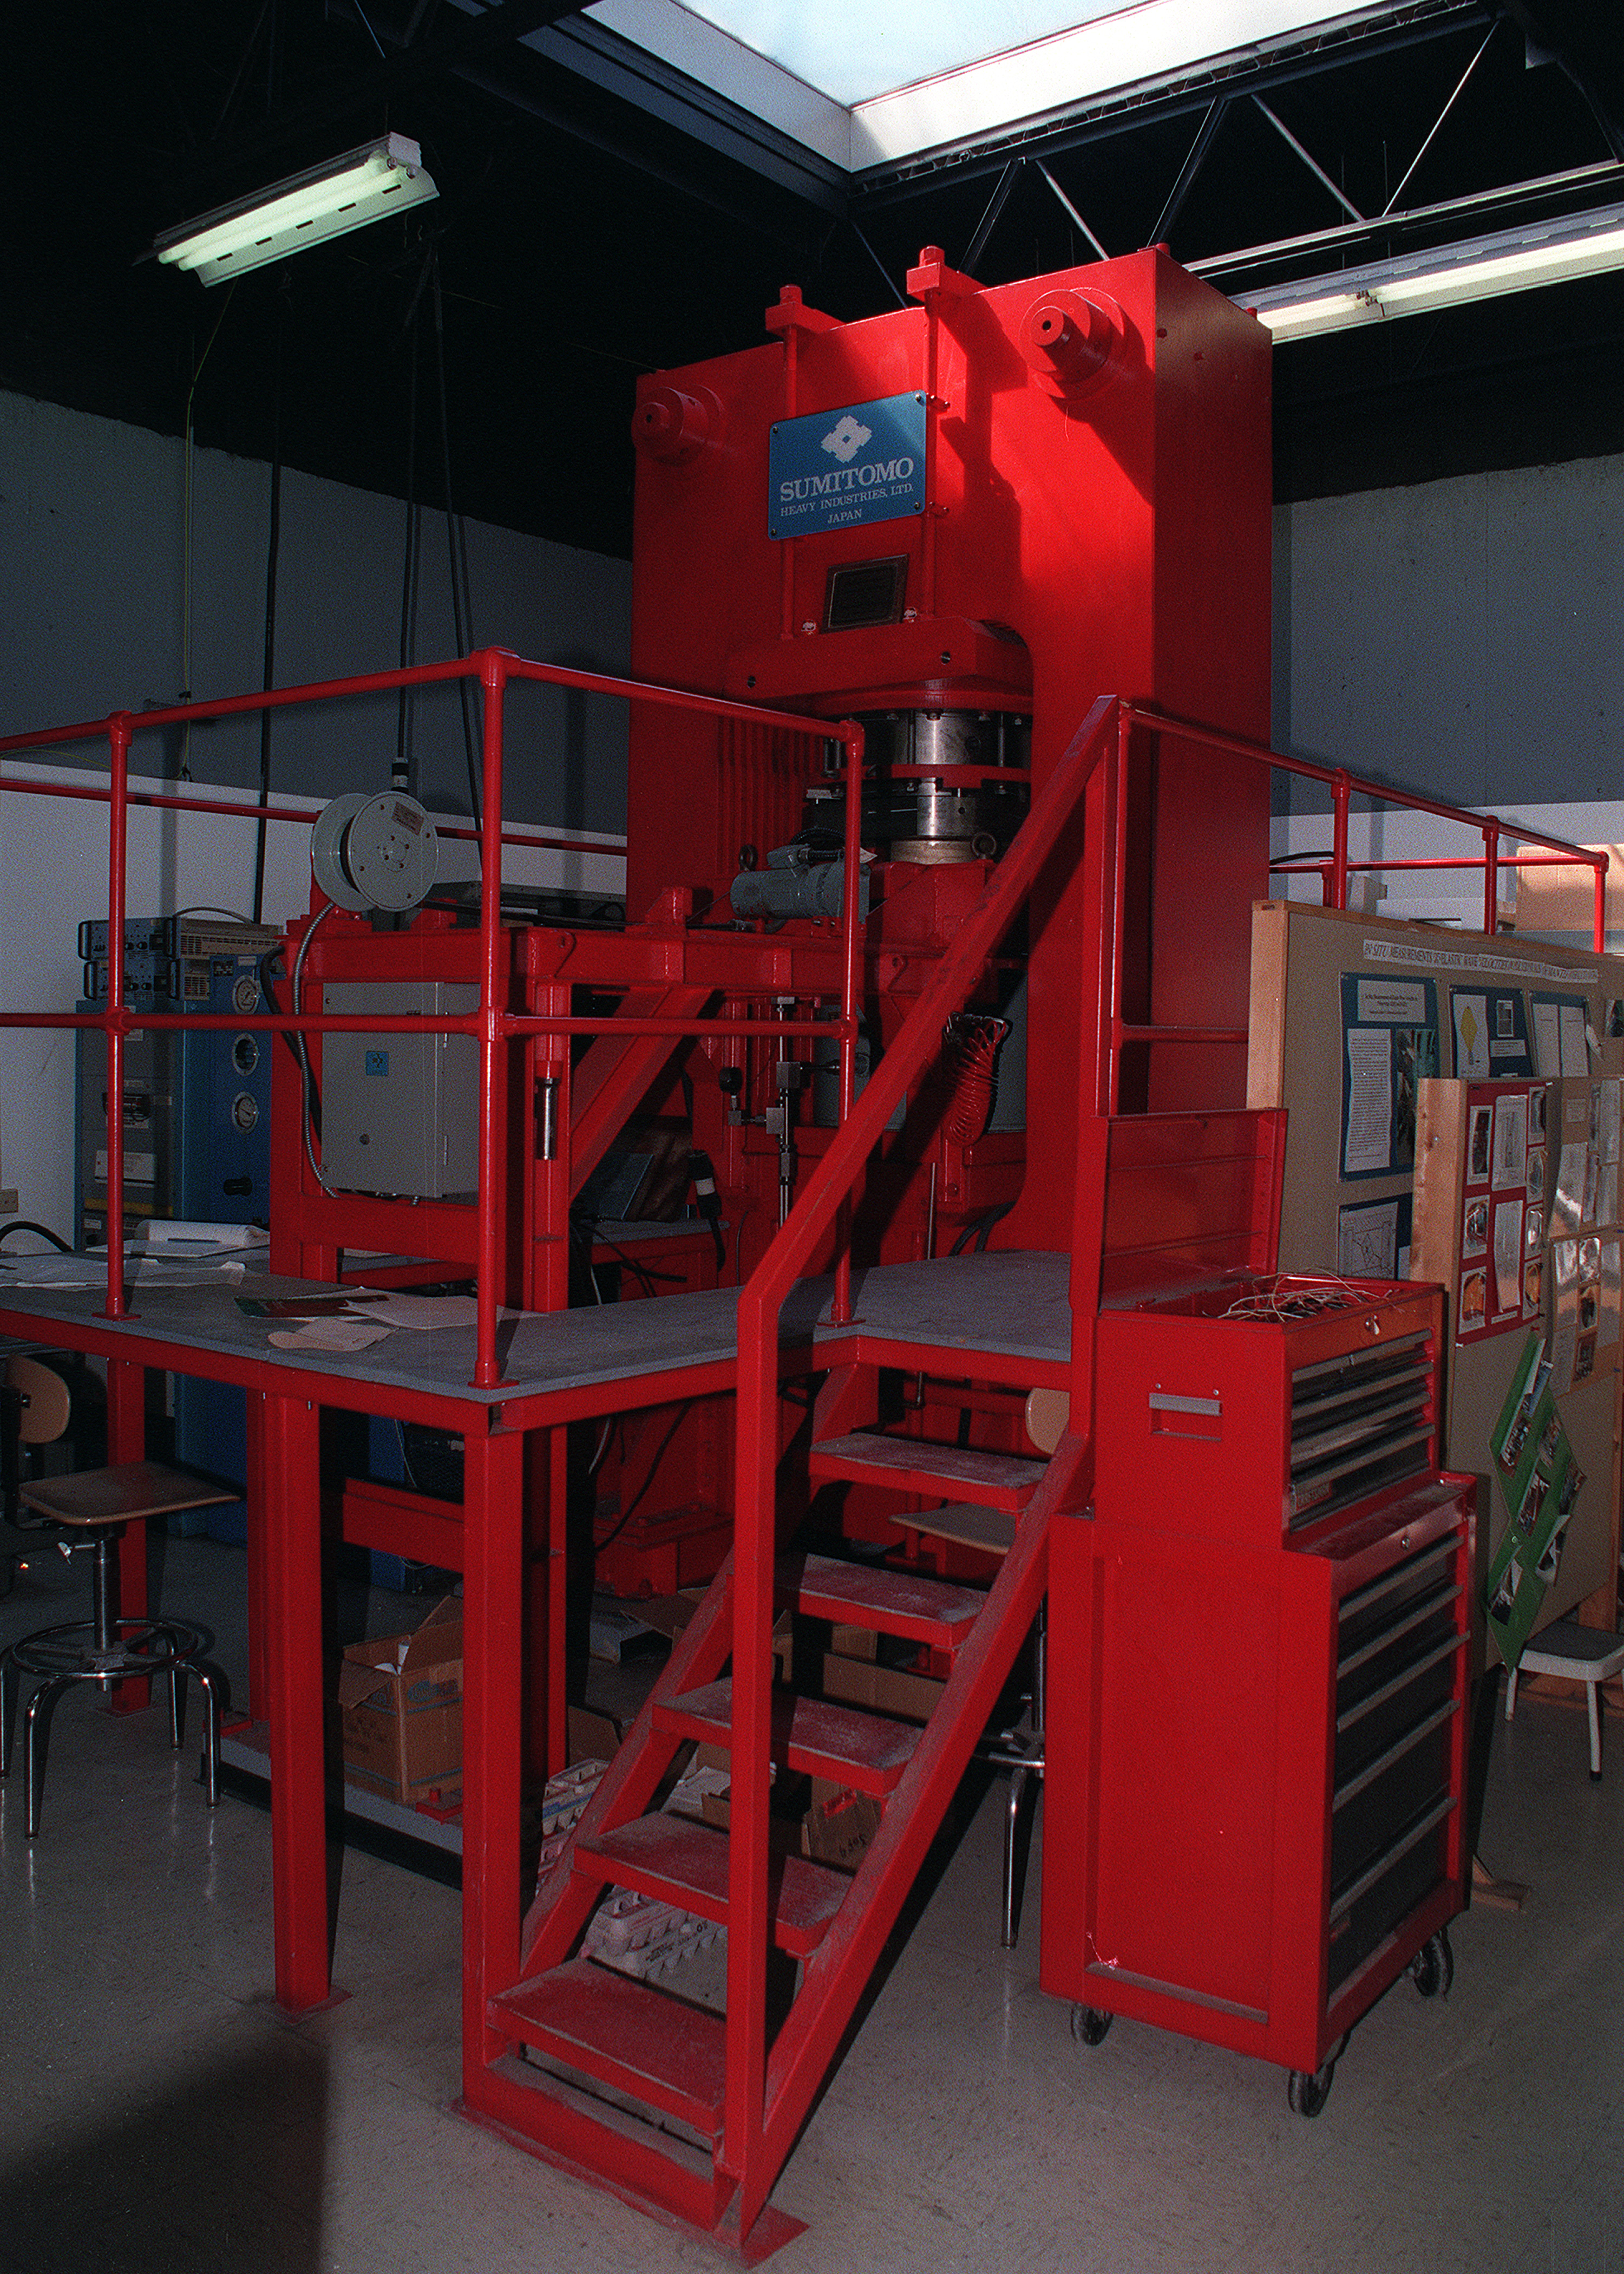
Picture of the 2000-ton uniaxial split-sphere apparatus (USSA-2000) which
is capable of generating pressures to 30 Gpa and temperatures of 3000
K. This is operated by the
Center for High Pressure
at The State University of New York, Stony Brook.
The instrument is used to synthesize materials thought to be
present inside the Earth, at relevant conditions. The recovered
samples are later studied by a host of analytical techniques. For
an interesting example of research performed with this instrument see T.
Gasparik and M.T. Hutchison (2000) Experimental evidence for the origin
of two kinds of inclusions in diamonds from the deep mantle Earth and
Planetary Science Letters 181, p. 103-114. Photo courtesy of Tibor
Gasparik.