Upside-Down Quakes
Duncan Agnew
Introduction
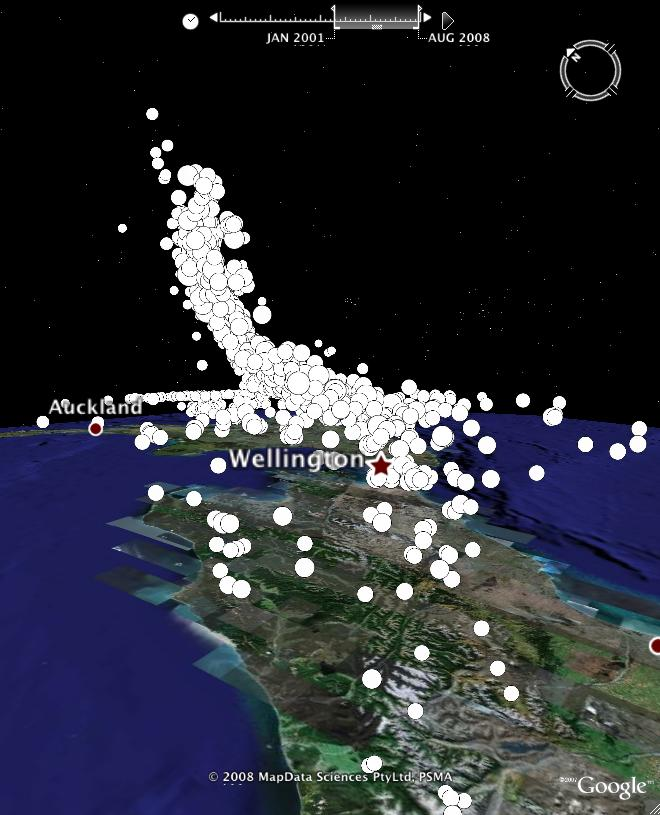
This page is provides information about the idea of displaying earthquakes in Google Earth™ (hereafter GE), or other "Earth browsers", by showing icons with the earthquake depth used as height, thus turning zones of seismicity upside-down. The picture below shows an example, looking north from a point over the South Island of New Zealand to show the inverted plane of earthquakes associated with the Hikurangi subduction zone, where the Pacific Plate is being subducted uner the Australian Plate. In the distance many earthquakes appear at the same height (inverted depth) because this is a standard value used in the locations. The locations of these earthquakes were taken from the New Zealand earthquake catalog.
A single static picture does not give the full flavor of the viewer; rather, the dynamic display feature of GE means that as you navigate to different locations in space, the icons are re-displayed as they would appear when you move, giving a good impression of their distribution in three dimensions without the need for a stereoscopic display.
This kind of display of earthquakes is created by putting the earthquake data into a format that can be read by the GE viewer, namely KML (Keyhole Markup Language). A brief introduction to this language, and to its use in displaying earthquakes, is given in this paper (1.7 Mb pdf), which I would ask that you reference if you make use of this system. The reference is: Agnew, D. C. (2009). Upside-Down Quakes: Displaying 3D seismicity with Google Earth, Seismol. Res. Lett., 80, 499-505, doi:10.1785/gssrl.80.3.499
KML is described more fully on the Google Earth website, at the Open Geospatial Consortium' and in a recently-published book.
Recent Earthquakes
I have created a file of the most recent earthquakes (data from the USGS), here. The presentation is in the same form as for the file of major earthquakes (below) but covers magnitudes 5.0 and above.
Major Earthquakes from 1900 on
For educational use, I have created a KML file showing large earthquakes since 1900, starting with the Centennial Earthquake Catalog created by Engdahl and Villasenor, and adding information about fatalities, short descriptions of earthquakes, and references (on the Web and in the scientific literature) that give more information. To find out more go here.
UDQ Software
To make it easier for others to create files for visualization, I haver written a software package that allows you to create your own files, given a listing of earthquakes that contains time, location (epicenter and depth) and magnitude. This package includes the ability to have the icons for earthquakes fade with time, with small events fading most quickly, something that is very useful when looking at behaviors in time and space. To find out more go here.