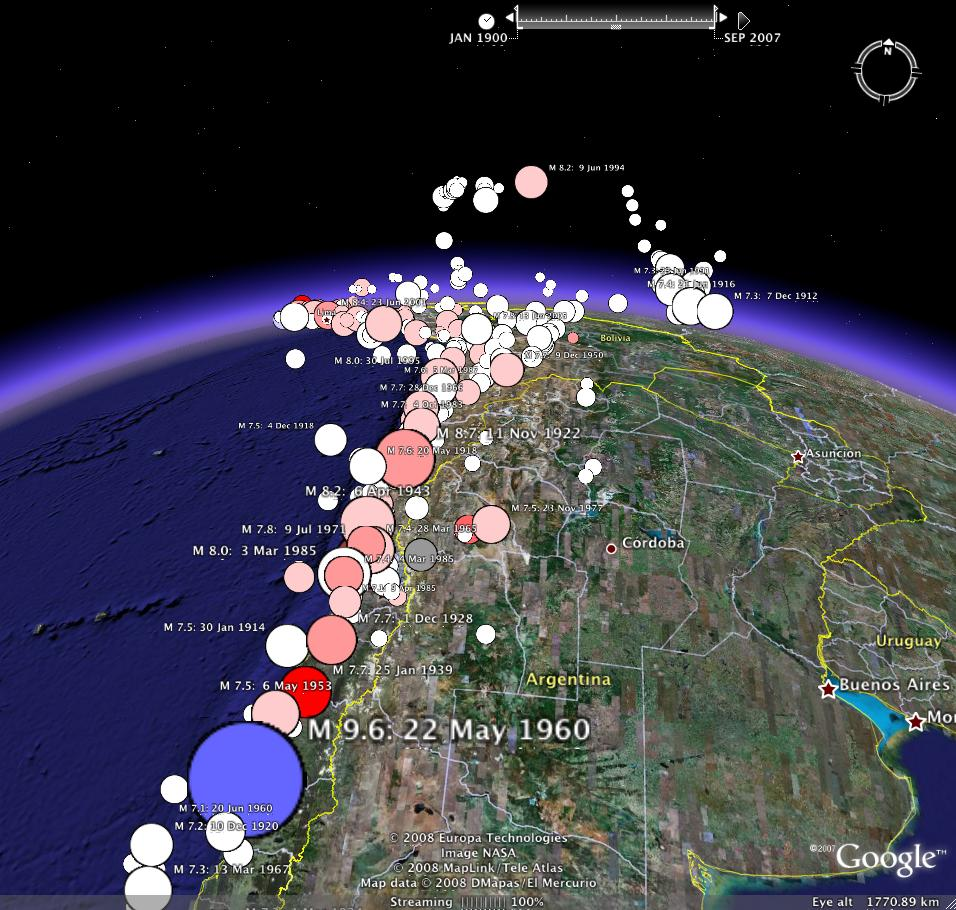
Looking north along the Andes. The great Chilean earthquake of 1960 appears in the foreground, and the very deep 1994 Bolivian earthquake in the distance.
Many people, when they think of earthquakes, think only of those they hear about as news: the shocks that cause death and destruction. But most earthquakes, even very large ones, do not make the news because there are no people near them: the earthquake may be under the ocean, hundreds of kilometers below the surface, or in a place with few inhabitants. So to look at how earthquakes are distributed we need to use records from seismometers, which can record earthquake waves even from sources very far away. This file is an attempt to present the earthquake distribution over the Earth for major earthquakes (magnitude 6.5 and above) after there has been a global network of seismometers, which was around 1900.
The most important facts about earthquake distributions are:
|
1. |
Most earthquakes occur in limited areas that are the boundaries between tectonic plates–though there are also intraplate earthquakes, whose causes are less well understood. |
|
2. |
The times at which earthquakes happen seem to be random with the big exception that many big earthquakes have lots of smaller ones following them in time and in the same general location: these are aftershocks. |
|
3. |
There are lots more small earthquakes than big ones: for example. roughly ten times as many magnitude 6’s per year as magnitude 7’s. |
|
4. |
Deep earthquakes (defined as those deeper than 60 km) almost all happen in a few areas where one plate is moving under another, a process called subduction. |
All of these phenomena are visible when this KML file is displayed on an Earth browser such as Google Earth. The special feature of this file is that the earthquakes are shown "upside down", with depth below the surface being turned into height above it, to make the earthquake locations appear to float in space. For example, one of the more active subduction zones dips to the east, getting deeper under Japan, and the Sea of Japan, and deepest under Korea. In this display, the earthquakes appear to be higher and higher, with the ones highest up being high over Korea instead of deep beneath it. Looking at this file should give you a better sense for this three-dimensional distribution–but remember that it is "inverted" from the real one.
Certainly a major reason for interest in earthquakes is that they can be very destructive. This feature is illustrated using different colored icons. White indicates that there were no deaths caused by the earthquake, while deeper and deeper shades of red indicate larger numbers of deaths caused by the shaking. Deeper shades of blue indicate larger numbers of deaths caused by tsunami.
Each earthquake location (its hypocenter) is labeled with the date and size. If you click on the corresponding icon, a balloon appears, containing, at a minimum, a complete set of parameters for time, location, and size, and also a geographic location (known to seismologists as a Flinn-Enghdal region.
For many earthquakes, the file also provides hyperlinks to additional information; when you click on these, a web browser will be opened to display what is linked to. These links include:
|
• |
The sources of information for the parameters given. |
|
• |
Web pages on particular earthquakes, particularly those maintained and updated by the National Earthquake Information Center of the U.S. Geological Survey. |
|
• |
Articles available online, whether popular accounts or scientific papers on the earthquake. I have focused on the latter to acquaint users with the nature of the scientific literature in this field. Clicking on these link takes you to the abstract of a scientific paper, though the article itself may not always be freely available. |
Different magnitudes are placed in different ‘‘folders’’ in the KML file, so you can look only at big (or small) earthquakes. Since each earthquake has a time associated with it, the Google Earth viewer automatically displays a slider bar, which can be adjusted to display only the earthquakes within a particular time interval. It thus becomes easy to look, for example, at just the magnitude 7’s in some location for the 1950’s, and then at the same magnitude group for the 1990’s. The slider bar can also be set to move forward in time automatically, providing a movie of seismicity over (say) a 5-year interval that gradually shifts from 1900–1904, through to 2003–2007.
The file is about 0.5 Mb (compressed as a .kmz file), and can be downloaded here. It can then be loaded into your Google Earth viewer, which will uncompress it and display it.
When the file is first opened, you will not see many earthquakes, This is because the time slider bar only shows a few early ones; if you move this so that the full timespan is shown, all the earthquakes will appear.
The display works best if you turn off the atmosphere in Google Earth.
The locations of many of the earthquakes before 1950 can be less accurate than those later. Earthquake locations before 1918 are often very uncertain, so to get the best picture of locations, you should exclude these. Also, for many earthquakes the numbers of fatalities are estimates, often not very good.
You should not base an eatimate of seismic hazard on these data, since they are not in any sense "official".
I have not tried to make the references complete, but would be happy to learn of useful Web resources that I have missed; see my homepage for how to contact me.
Much of the data in this file was taken from the catalog of Engdahl and Villasenor (2002), who created the IASPEI Centennial Catalog, also called the Engdahl-Villasenor Centennial (EVC) Catalog. This catalog combines results from older catalogs with relocations using the method of Engdahl, van der Hilst, and Buland (1998), which are much better than those in the International Seismological Summary (ISS). Engdahl and Villasenor combined these locations with locations in the International Seismological Summary, in Gutenberg and Richter (1954), in Abe (1981, 1984), and in Utsu (1979, 1982, 1983), and with magnitude estimates from a wide range of sources, to provide a global seismicity catalog complete above magnitude 7.5 from about 1910 on, and above magnitude 6.5 from about 1950.
To keep the display relatively uncrowded, only earthquakes magnitude 6.5 and above are included; the locations and magnitudes for these are almost all taken from an updated version of the EVC catalog provided by A. Villasenor (pers. commun.), with some corrections from Ambrayses and Melville (1982) and from Frohlich (2006). Since much popular interest in earthquakes stems from their role as natural hazards, I augmented the catalog with information on fatalities from the Significant Earthquake Database at the National Geophysical Data Center, along with earthquake names from the Catalog of Damaging Earthquakes compiled by Dr. T Utsu. Many of the Web links are from the USGS list.
References Not Linked
Engdahl, E. R., and A. Villasenor (2002). Global Seismicity: 1900-1999, pp. 665-690 in International Earthquake and Engineering Seismology Part A, (New York, N.Y.: Elsevier Academic Press)
Utsu, T. (1979)--see this link but note that the author’s name is incorrectly given as Tsu.